
Python challenge 4 - How long would it take to walk every street in Oxford?
One of the most interesting features of the internet is the ability to collect large amounts of geographical data from around the world. A set of geographical data within a computer is stored and manipulated using a Geographic Information System, or GIS. One particular application of this is for creating maps and features within those maps.
How long would it take to walk every street in Oxford?
The OpenStreetMap is an Open Source map that can be edited and modified by users. It is possible to call the database to find information using an API (as you tried in the previous challenge). The range of information that can be represented in this way is broad, and includes things such as towns, buildings, roads or parks.
In this challenge, the API for OpenStreetMap is called to obtain and study geographic information in a region of interest. The API is not native to Python, and so obtaining the information may be more involved than the last challenge.
Target:
Write one page of Python that will:
- Call the API to find the names of all cities in the UK.
- Plot the outline of Oxford, and count the number of ‘university’ tagged buildings.
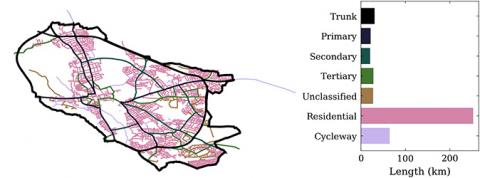
- Plot the Oxford road network by road type.
Extensions:
- Calculate the length of each of the types of road within Oxford, and therefore estimate the time it would take to walk all roads.
- Populate your map with the locations of Oxford colleges at the university.
Try to get as far as you can on your own before viewing the hints or the solution
-
Hints for Python Challenge 4
Packages
- In this challenge there are likely to be a large number of ways of achieving the outcome. The json and requests packages are used for calling and retrieving the API calls in the solution we have developed.
- The API used for calling OpenStreetMap is called overpass. There is an interactive online version for quickly testing commands called overpass turbo that may be useful.
Hints
- It will likely be quite difficult to complete this challenge without using the online documentation for both the API and OpenStreetMap itself to understand how they construct the map.
- Latitude and longitude are not the same as co-ordinates in the plane, and so we can’t directly use these to find distances on a map using the pythagorean formula √(x2+y2). What can we use instead?
- The area type cannot be nested natively. Using the map to area command might help to identify subregions.
Notes
- One of the challenges with this task is that the length and number of API calls must be kept small. Inefficient calls to the API can cause the code to become very slow, so try different options.
- Note that servers called by the API can sometimes be busy. The HTTP return code can be used to identify the reason for the call failing.
-
Solution for Python Challenge 4
# ===== Challenge 4 - How long would it take to walk every street in Oxford?

import matplotlib.pyplot as plt
from geopy import distance
import requests

def roq(opq):
    """Request Overpass Query"""
    overpass_url = "http://overpass-api.de/api/interpreter"
    response = requests.get(overpass_url, params={'data': opq})
    if response.status_code is not 200:
        print('Error! Code:', response.status_code)
    return response.json()['elements']

def plotRelGeom(e):
    for w in e[0]['members']:
        lat = []
        lon = []
        if w['type'] == 'way':
            for n in w['geometry']:
                lat.append(n['lat'])
                lon.append(n['lon'])
            plt.plot(lon, lat, 'k', linewidth=2)

def plotGeomSet(e, clr='k', th=0.8):
    opq_len = 0
    for w in e:
        lat = []
        lon = []
        if w['type']=='way':
            for n in w['geometry']:
                lat.append(n['lat'])
                lon.append(n['lon'])
            plt.plot(lon, lat, color=clr, linewidth=th)
        for i in range(len(lat)-1):
            p0 = (lat[i], lon[i])
            p1 = (lat[i+1], lon[i+1])
            opq_len = opq_len + distance.distance(p0, p1).km
    return opq_len

# Task 1: get a list of cities in the UK
overpass_query = '[out:json];area["ISO3166-1"="GB"];(node[place="city"](area););out;'
uk_cities = roq(overpass_query)

# Task 2: Plot Oxford City outline
opq_oxford = """[out:json];area["ISO3166-1"="GB"];
rel(area)[name="Oxford"][type=boundary]; out geom;"""
plotRelGeom(roq(opq_oxford))

# Task 3 + Extension: plot road types and their respective lengths.
road_types = ['trunk','primary','secondary','tertiary','unclassified','residential','cycleway']

road_opq_len = []
for r_type in road_types:
    # By inspecting the Oxford area, we find the area code is 3600394037
    print(r_type)
    opq = "[out:json];way[highway=" + r_type + "](area:3600394037); out geom;"
    road_opq_len.append(plotGeomSet(opq, roq(opq)))
plt.axis('equal')
plt.grid()
plt.axis('off')
plt.show()
Ready for the next challenge?
Click here to explore 'How computers modify images'